What’s new in Salesforce Winter ’27
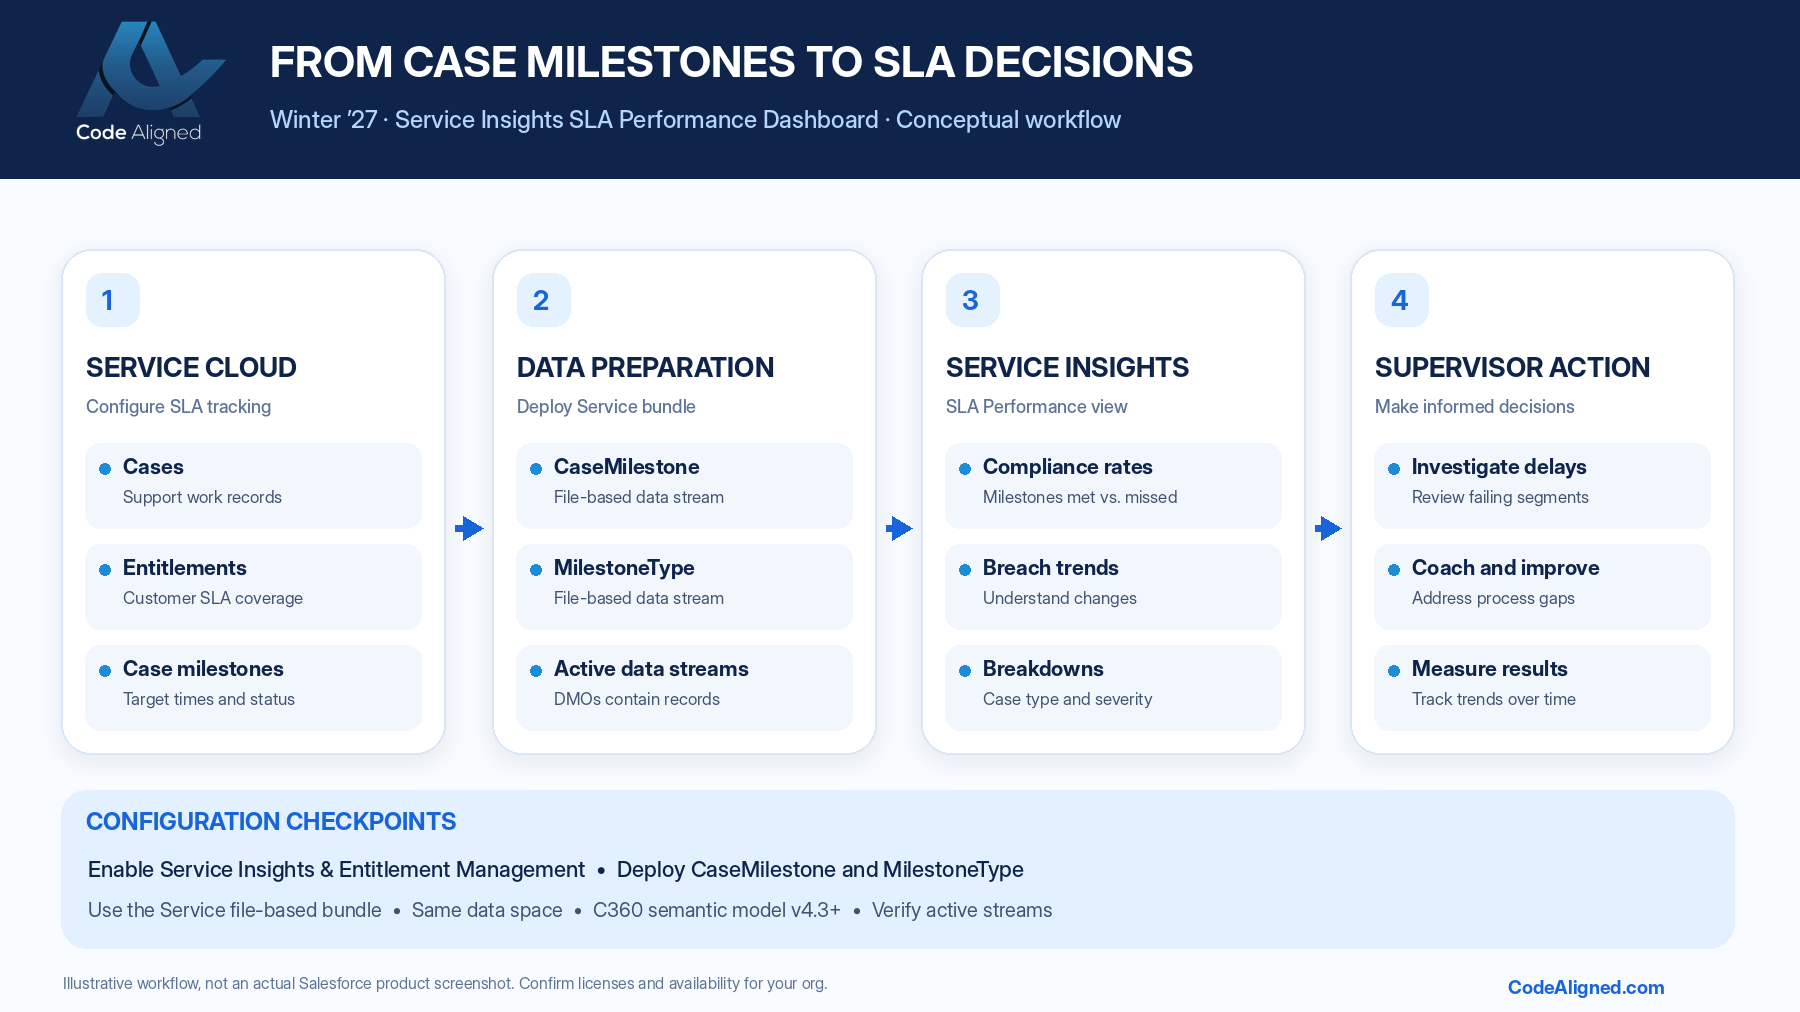
Winter ’27 adds a prebuilt Salesforce SLA Performance Dashboard to Service Insights. According to the Winter ’27 release note for the SLA Performance Dashboard, it gives supervisors a ready-made view of:
- SLA compliance rates: how often commitments are met
- Milestone breach trends: how breaches change over time
- Breaches by case type: which kinds of cases miss most often
- Breaches by severity: whether misses concentrate in critical work
Visibility, not prevention
The dashboard reports on what happened. It doesn’t prevent breaches, predict them with AI, or change how cases are routed. Those outcomes still depend on your entitlements, milestones, routing, and staffing.
Business value and operational impact
Salesforce orgs could report on SLAs before Winter ’27, using Entitlement Management, milestones, and custom reports and dashboards. What changes is that a prebuilt performance view is available in Service Insights, so supervisors don’t have to assemble the picture themselves. Used well, it helps them:
- Identify bottlenecks: see where breaches cluster by case type or severity.
- Investigate repeated breaches: spot patterns that keep recurring rather than chasing individual cases.
- Prioritize critical categories: focus first on severities and case types with the most contractual exposure.
- Guide coaching: bring specific breach patterns into team reviews.
- Inform resource decisions: base staffing and skills discussions on observed breach trends.
| Task | Fragmented manual analysis | Prebuilt SLA performance view |
|---|---|---|
| Getting the numbers | Exports, custom reports, and spreadsheets assembled by an analyst | A prebuilt dashboard in Service Insights |
| Consistency | Definitions can drift between reports and teams | One shared view for supervisors |
| Trend analysis | Built manually, often monthly | Milestone breach trends shown over time |
| Root-cause focus | Hard to see patterns across case types and severities | Breaches broken down by case type and severity |
| Action | Depends on people | Still depends on people. The dashboard informs decisions; it doesn’t make them. |
A practical business example
This is an illustrative scenario. The organization is hypothetical, and no results are measured or implied.
A B2B technical support organization serves customers on three entitlement tiers: Standard, Premium, and Mission Critical. Each tier has different first-response and resolution milestones. Overall case numbers look healthy, but the account team keeps hearing complaints from Premium customers.
- Identify repeated breaches. The supervisor sees in the SLA Performance Dashboard that first-response breaches recur in high-severity cases.
- Investigate affected case types and milestone records. Breaches concentrate in one case type, integration errors. The supervisor opens sample cases and their milestone records to confirm the breaches are real, not a business-hours misconfiguration.
- Review routing and escalation. Integration-error cases land in a general queue first and are reassigned to specialists later, which uses up the response window.
- Assign corrective actions. Owners are named: one to change routing for that case type, one to review the escalation rule, and one to check specialist coverage at peak times.
- Monitor results over time. The team watches breach trends for that case type and severity in the following weeks to see whether the changes help.
Salesforce requirements and availability
Based on the release note and the Winter ’27 feature impact table:
| Requirement | Detail |
|---|---|
| Release | Salesforce Winter ’27 |
| Interface | Lightning Experience |
| Editions | Professional, Enterprise, and Unlimited |
| Features | Service Insights with Entitlement Management |
| Setup | Administrator setup required. It isn’t automatic. |
| Data | Case milestone data deployed to Data Cloud (now Data 360) |
| Semantic model | C360 semantic model version 4.3 or later, as specified in the deployment documentation |
The data architecture is straightforward. Entitlements and milestones live on cases in Service Cloud. The Salesforce CRM connector streams case milestone and milestone type records into Data Cloud. Service Insights reads them from the same data space to build the dashboard. If Entitlement Management is unavailable, or any part of that chain is incomplete, the dashboard isn’t visible.
Step-by-step implementation
These steps follow Salesforce’s guide to deploying case milestone data for Service Insights. Use the guide for exact screens, because labels can change between releases.
- Verify edition, feature availability, and Entitlement Management for your org.
- Open Service Insights setup and enable the required Service Cloud features.
- Enable and configure Entitlement Management, including entitlement processes and milestones that reflect your real contracts.
- Open Data Cloud and create data streams through the Salesforce CRM connector.
- Select the file-based Service bundle. There’s more than one Service bundle, so check you have the file-based one.
- Deploy
CaseMilestoneandMilestoneTypeinto the same data space Service Insights uses. - Confirm the streams are Active, and that the
CaseMilestone__dlmandCaseMilestoneType__dlmobjects contain data. - Refresh Service Insights setup and verify the dashboard is visible.
- Validate the figures against case milestone outcomes you already know.
Configuration checklist
- Edition and Service Insights availability confirmed
- Entitlement processes and milestones match contracts
- Business hours verified on entitlement processes
- File-based Service bundle selected
- Data space matches Service Insights
- Data streams Active, and both objects contain data
- C360 semantic model at version 4.3 or later
- Dashboard figures reconciled with sample cases
Common mistakes
- Missing entitlement configuration. Without entitlement processes and milestones on cases, there’s nothing to measure.
- Selecting the wrong data bundle. The deployment guide calls for the file-based Service bundle.
- Inactive data streams. A stream that was created but isn’t Active leaves the dashboard empty or hidden.
- Wrong data space. Data deployed to a different data space from Service Insights won’t be found.
- Incomplete milestone data. Cases without entitlements, or historic cases created before milestones existed, can skew compliance rates.
- Trusting numbers without checking the rules. Compliance depends on business hours and milestone definitions. If they don’t match your contracts, the dashboard faithfully reports the wrong thing.
A 30/60/90-day service improvement plan
A recommended practice for turning dashboard visibility into action. The benefits are potential, not guaranteed, and depend on the changes you make.
Keep the plan narrow. Two or three well-owned breach categories will teach you more than an initiative that tries to fix every queue at once.
How Code Aligned can help
The dashboard is only as good as the entitlements, milestones, and data behind it. Code Aligned is a Salesforce consulting partner that helps service organizations get that foundation right:
- Service Cloud implementation and optimization
- Entitlement and milestone configuration that reflects your actual contracts and business hours
- SLA dashboard readiness, including Data Cloud streams, bundles, data spaces, and semantic model checks
- Data validation so supervisors can trust the numbers
- Routing optimization and service operations improvement based on what the dashboard reveals
Explore our Salesforce services, Salesforce implementation, and Salesforce managed services.
Frequently asked questions
What does the SLA Performance Dashboard measure?
According to the Winter ’27 release notes, it shows SLA compliance rates, milestone breach trends, and breach patterns by case type and by severity, based on case milestone data.
Which Salesforce editions support it?
Salesforce documents it for Lightning Experience in Professional, Enterprise, and Unlimited editions, with Service Insights and Entitlement Management. Confirm availability for your org before planning around it.
Is Entitlement Management required?
Yes. The dashboard depends on Entitlement Management and case milestone data. If Entitlement Management is unavailable or the required setup is incomplete, the dashboard isn’t visible.
Does the dashboard prevent SLA breaches automatically?
No. It’s a reporting view that shows compliance and breach patterns. It doesn’t predict, prevent, or resolve breaches. Preventing them still depends on your routing, escalation, staffing, and milestone processes.
Why might the dashboard not appear?
Common causes include Entitlement Management not being enabled or configured, the wrong data bundle being selected, case milestone data streams that aren’t Active, data deployed to a different data space from Service Insights, or a C360 semantic model older than version 4.3.
How does SLA reporting differ from standard case reporting?
Standard case reporting measures activity, such as how many cases were opened, closed, or handled. SLA reporting measures commitments: whether response and resolution milestones defined in your entitlements were met on time.
Official Salesforce references
Product behavior in this article is based on the following Salesforce documentation. Confirm current details before you implement.